



QOF Prevalence 2025/26: What the Latest GP Disease Register Data Really Shows
Key Takeaways
- Disease registers under the Quality and Outcomes Framework (QOF) added 1.88 million entries in 2025/26, despite a slight overall reduction in England’s registered population.
- Rising QOF register figures primarily reflect enhanced case-finding, systematic clinical coding, and proactive diagnostic pathways rather than a sudden surge in true epidemiological illness.
- Hypertension passed the 10 million patient mark, remaining the condition with the highest recorded prevalence (15.8%), closely followed by depression (14.9%) and obesity (14.3%).
- Cardiometabolic conditions, including heart failure (+7.7%) and non-diabetic hyperglycaemia (+7.3%), represent the fastest-growing major registers across primary care.
- Deploying dedicated ARRS clinical pharmacists enables practices to convert QOF register insights into proactive clinical care and structured medication reviews without overloading GP partners.
Introduction
England’s GP disease registers added nearly 1.9 million entries in 2025/26, yet the total registered population across the country actually decreased slightly. At first glance, this appears paradoxical.. Does a shrinking population accompanied by rapidly expanding disease registers mean the nation is suddenly becoming sicker?
Not necessarily. The official Quality and Outcomes Framework (QOF) publication covering 6,145 general practices and 98.3% of eligible surgeries across England reveals that changes in QOF registers often reflect diagnostic thoroughness, improved clinical coding, and enhanced case-finding rather than pure epidemiological shifts. According to an insightful analysis by ARJUS, understanding the mechanisms sitting behind the QOF prevalence 2025/26 data is essential for Practice Managers, Primary Care Network (PCN) Leads, and GP Partners evaluating their clinical priorities and workload strategies.
What Is QOF Prevalence?
Introduced in 2004 as part of the General Medical Services (GMS) contract, the Quality and Outcomes Framework rewards general practices for the quality of care they deliver. Central to QOF are clinical disease registers, which identify cohorts of patients diagnosed with specific long-term conditions to ensure they receive structured monitoring and evidence-based interventions.
It is crucial to distinguish between recorded QOF prevalence and true epidemiological prevalence:
Recorded QOF Prevalence (%) =Patients Recorded on QOF RegisterRelevant Practice Population denominator 100
While epidemiological prevalence estimates the total proportion of a population living with a condition (including those undiagnosed), QOF prevalence measures only those patients who have been formally diagnosed, coded, and placed on a practice register. Furthermore, population denominators vary by condition; while some registers cover the entire practice population, others apply only to specific age brackets, such as adults aged 18 and over.
The Headline: 1.88 Million More Register Entries
Across the 21 clinical registers tracked in the QOF dataset, primary care added approximately 1.88 million net entries in 2025/26, representing an overall growth rate of +3.7% year-on-year. In contrast, England’s total registered patient population fell slightly from 63.77 million to 63.67 million (-0.14%).
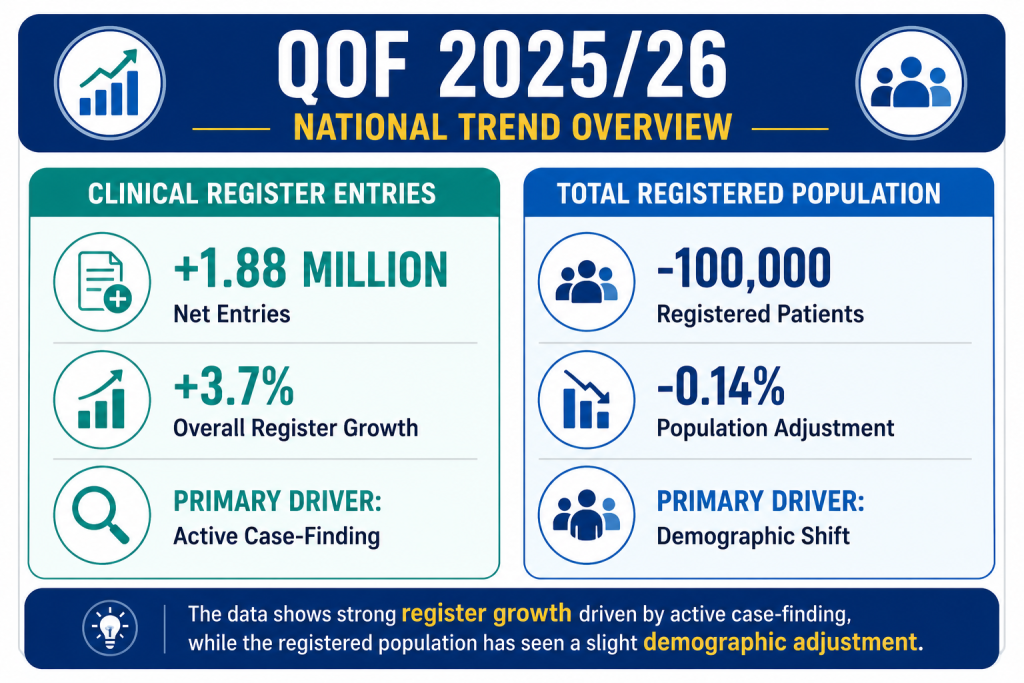
This divergence demonstrates that expanding registers are largely driven by healthcare activity. Improved electronic health record audits, targeted screening, and refined clinical coding mean that general practices are systematically identifying previously unrecorded disease. As NHS England explicitly notes in its technical guidance, QOF data reflects clinical case-finding and coding practices rather than pure population health changes.
Which Conditions Are Driving the Increase?
While overall register volume grew, individual conditions exhibited vastly different trajectories. Recorded prevalence rates remain concentrated in a small group of high-volume conditions:
| Condition | 2025/26 Recorded Prevalence | Annual Net Entry Change | Key Narrative |
| Hypertension | 15.8% | +326,000 patients | Crossed 10 million milestone; remains largest single register. |
| Depression | 14.9% | Strong continued growth | High consultation frequency and ongoing mental health coding. |
| Obesity | 14.3% | Substantial adult cohort | High recorded prevalence driven by routine BMI assessments. |
| Non-Diabetic Hyperglycaemia | 9.9% | +349,000 patients (+7.3%) | Fastest-growing major register; reflects NHS Diabetes Prevention focus. |
| Heart Failure | ~1.7% | +7.7% relative growth | Fastest relative growth across all 21 clinical registers. |
| Chronic Kidney Disease (CKD) | ~4.8% | +4.8% relative growth | Driven by automated eGFR/urine ACR screening pathways. |
| Atrial Fibrillation (AF) | ~2.5% | +4.0% relative growth | Enhanced pulse checks and opportunistic screening initiatives. |
Why Hypertension Crossing 10 Million Matters
A major milestone in the QOF prevalence 2025/26 dataset is the hypertension register surpassing 10 million patients for the first time. Reaching a recorded prevalence of 15.8%, general practices added roughly 326,000 patients to hypertension registers over the twelve-month period.
Far from indicating a negative health trend, an expanding hypertension register represents a major public health victory. Identifying unmanaged high blood pressure is one of the most cost-effective methods for preventing clinical events such as strokes, myocardial infarctions, and vascular dementia. Nevertheless, public health models suggest a remaining gap between recorded patients and underlying population prevalence, highlighting that active case-finding in primary care must remain an ongoing priority.
The Fastest Growing Registers: Heart Failure and Pre-Diabetes
Cardiometabolic conditions experienced the steepest relative growth rates across primary care in 2025/26:
- Heart Failure (+7.7%): Marked the highest relative expansion of any QOF register. Improved access to natriuretic peptide (NT-proBNP) testing and echocardiography pathways has enabled earlier diagnostic confirmation in general practice.
- Non-Diabetic Hyperglycaemia (+7.3%): Added approximately 349,000 patients, bringing recorded prevalence to 9.9%. This expansion aligns with systematic HbA1c screening and referrals into the NHS Diabetes Prevention Programme.
- Diabetes Mellitus: Added roughly 129,000 patients, continuing a steady upward trajectory driven by metabolic health screening.
These findings show that primary care is actively finding disease early in the pathway, allowing clinicians to initiate lifestyle interventions and preventive therapies before organ damage occurs.
The Two Outliers: Asthma and Osteoporosis
Understanding QOF data requires looking not only at rapid growth but also at unexpected stagnation or decline:
Asthma (+0.1% Growth)
With an addition of just 2,141 patients nationwide, the asthma register remained virtually flat. This stabilisation reflects stricter diagnostic requirements introduced into QOF business rules, which require objective diagnostic confirmation, such as spirometry, FeNO testing, or peak flow variability before a new diagnosis can be formally coded on the register.
Osteoporosis (-2.8% Decline)
Osteoporosis was the only clinical register in England to contract in 2025/26, dropping by 7,826 patients (-2.8%). This contraction coincided with the retirement of financial points associated with the OST004 indicator. When explicit financial incentives were removed, routine register administration slowed, allowing natural register attrition (e.g., patient deaths or list movement) to outpace new registrations.
These outliers prove an essential point: a rising register does not automatically mean more disease, and a falling register does not automatically mean less disease.
Why QOF Prevalence Should Never Be Read in Isolation
To interpret QOF data accurately, primary care leaders must evaluate five underlying operational factors:
- Case-Finding Intensity: Structured screening campaigns directly expand registers without changing underlying disease rates.
- Clinical Coding Accuracy: Standardising SNOMED codes across a PCN can instantly shift register figures.
- QOF Business Rule Updates: Changes to age parameters, diagnostic criteria, or exclusion rules alter who qualifies for a register.
- Cumulative Register Definitions: The cancer register, for instance, includes all diagnoses made since April 2003. A 5.1% increase in the cancer register reflects historical survival accumulation rather than a 5.1% spike in annual cancer incidence.
- Denominator Differences: Comparing raw percentages between registers can be misleading if one condition covers all ages while another applies only to patients aged 45 and over.
What the 2025/26 QOF Changes Tell Us About Primary Care Priorities
The QOF prevalence 2025/26 statistics must be interpreted alongside wider changes in the GP contract. In 2025/26, NHS England retired 32 income-protected indicators (worth 212 points), redistributing 141 points directly into nine cardiovascular disease (CVD) prevention indicators.
This structural reallocation incentivised practices to focus clinical sessions on lipid management, blood pressure optimisation, and anticoagulation in atrial fibrillation. When primary care contracts shift financial incentives toward specific clinical domains, general practice activity and clinical register recording naturally follow.
How TMMT Supports GP Practices with QOF Data and Clinical Capacity
Translating complex QOF register insights into proactive clinical care requires significant time and staff resources, capacity that busy general practices rarely have spare. The NHS Additional Roles Reimbursement Scheme (ARRS) provides dedicated funding for practices and PCNs to expand their clinical workforce, yet managing these roles internally can create heavy supervisory demands for GP partners.
This is where The Medicines Management Team (TMMT) provides essential support through specialised medicines management services. TMMT supplies experienced ARRS clinical pharmacists and pharmacy technicians embedded within an ISO 9001-certified operational framework.
What Should GP Practices Do with This Data?
Practice Managers, PCN Leads, and GP Partners can take several practical steps to use national QOF data to improve practice operations:
- Benchmark Local Prevalence: Compare your practice’s recorded prevalence against PCN, ICB, and national averages to identify potential under-diagnosis or miscoding.
- Investigate Register Anomalies: Conduct internal audits if registers experience sudden contractions or unexplained growth halts.
- Standardise Clinical Coding: Establish clear coding protocols for clinical staff, ensuring that diagnostic terms entered during consultations translate accurately into QOF business rules.
- Focus on High-Impact Case-Finding: Prioritise opportunistic screening in cardiometabolic areas such as pre-diabetes, hypertension, and chronic kidney disease.
- Avoid Performance League Tables: Use QOF data internally for quality improvement rather than viewing raw prevalence as a competitive ranking.
What Is Changing in QOF 2026/27?
Looking forward, NHS England’s 2026/27 QOF guidelines introduce further refinements designed to align primary care incentives with modern clinical guidelines:
- Diabetes Care Processes: Updated indicators focusing on comprehensive metabolic risk factor management.
- Enhanced Obesity Indicators: Two new measures targeting referrals to weight-management services, shared decision-making, and pharmacotherapy pathways.
- Heart Failure Management: Revised indicators incorporating the NICE-recommended “four pillars” of heart failure therapy.
- Childhood Immunisations: Revised achievement thresholds and refined business rules for vaccination tracking.
These updates demonstrate that QOF is an evolving management tool. Staying ahead requires continuous clinical governance rather than last-minute audit rushes.
Conclusion: Optimising Register Insights for Better Patient Care
The primary takeaway from the QOF prevalence 2025/26 dataset is that expanding disease registers reflect proactive clinical care, refined diagnostic pathways, and accurate clinical coding. When general practices view register growth as an indicator of successful case-finding rather than worsening public health, QOF data becomes a powerful tool for population health management.
By pairing NHS ARRS workforce funding with established management structures, general practices and PCNs can optimise their clinical registers, protect GP partner capacity, and deliver high-quality, evidence-based care. Practice leaders seeking to enhance their pharmacy capacity and streamline clinical governance are invited to explore tailored operational support options with The Medicines Management Team.
Frequently Asked Questions
QOF prevalence is the percentage of registered patients in a GP practice who are formally diagnosed, coded, and recorded on a specific Quality and Outcomes Framework disease register relative to the relevant population denominator.
The recorded QOF prevalence for hypertension in England reached 15.8% in 2025/26, with the national register exceeding 10 million patients for the first time.
Hypertension has the highest recorded prevalence at 15.8%, followed by depression at 14.9% and obesity at 14.3%.
Not necessarily. Rising QOF prevalence usually reflects improved case-finding, systematic screening, better clinical coding, and updated clinical pathways that bring undiagnosed patients onto practice registers.
The osteoporosis register shrank by 2.8% (-7,826 patients) following the retirement of financial points associated with indicator OST004, demonstrating how changes in QOF incentives can influence register maintenance and coding activity.
QOF prevalence is calculated by dividing the number of patients on a specific disease register by the practice population denominator specified for that condition, multiplied by 100. Denominators vary depending on whether the register applies to all patients or specific age groups.
The official 2025/26 publication includes data from 6,145 general practices across England, representing 98.3% of eligible surgeries.
ARRS clinical pharmacists conduct systematic record searches, resolve coding discrepancies, perform high-risk drug safety audits, and carry out Structured Medication Reviews, ensuring QOF registers remain accurate and up to date without overburdening GP partners.